Gantt charts provide a clear and structured way to manage project timelines, job dependencies, and overall workflow. In Ascora, the Gantt Chart feature helps you track job schedules, monitor project progress, and make real-time adjustments as needed.
By utilizing Project Gantt Charts and Jobs Gantt Charts, businesses can:
- Visualize project timelines and dependencies.
- Adjust job schedules easily with drag-and-drop functionality.
- Monitor progress using percentage completion tracking.
- Manage job relationships by creating dependencies between tasks.
- Quickly reschedule tasks or entire projects when needed.
These interactive tools ensure that projects remain on track and allow for better planning and coordination across teams. Whether you’re handling multiple jobs or managing large-scale projects, Ascora’s Gantt Chart feature offers the flexibility needed for efficient project execution.
Contents
- Gantt Chart Overview
- How to Display Projects Only
- How to edit Start/End Dates & Completion Percentage
- How to Reschedule Tasks
- How to Create Dependencies
- How to Remove Dependencies
- How to Resize the Gantt Chart
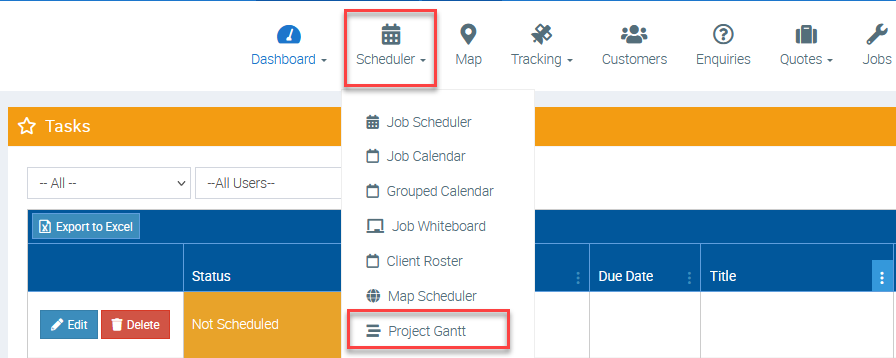
There are a couple of ways to access the Gantt Chart, one is from the Scheduler → Project Gantt.
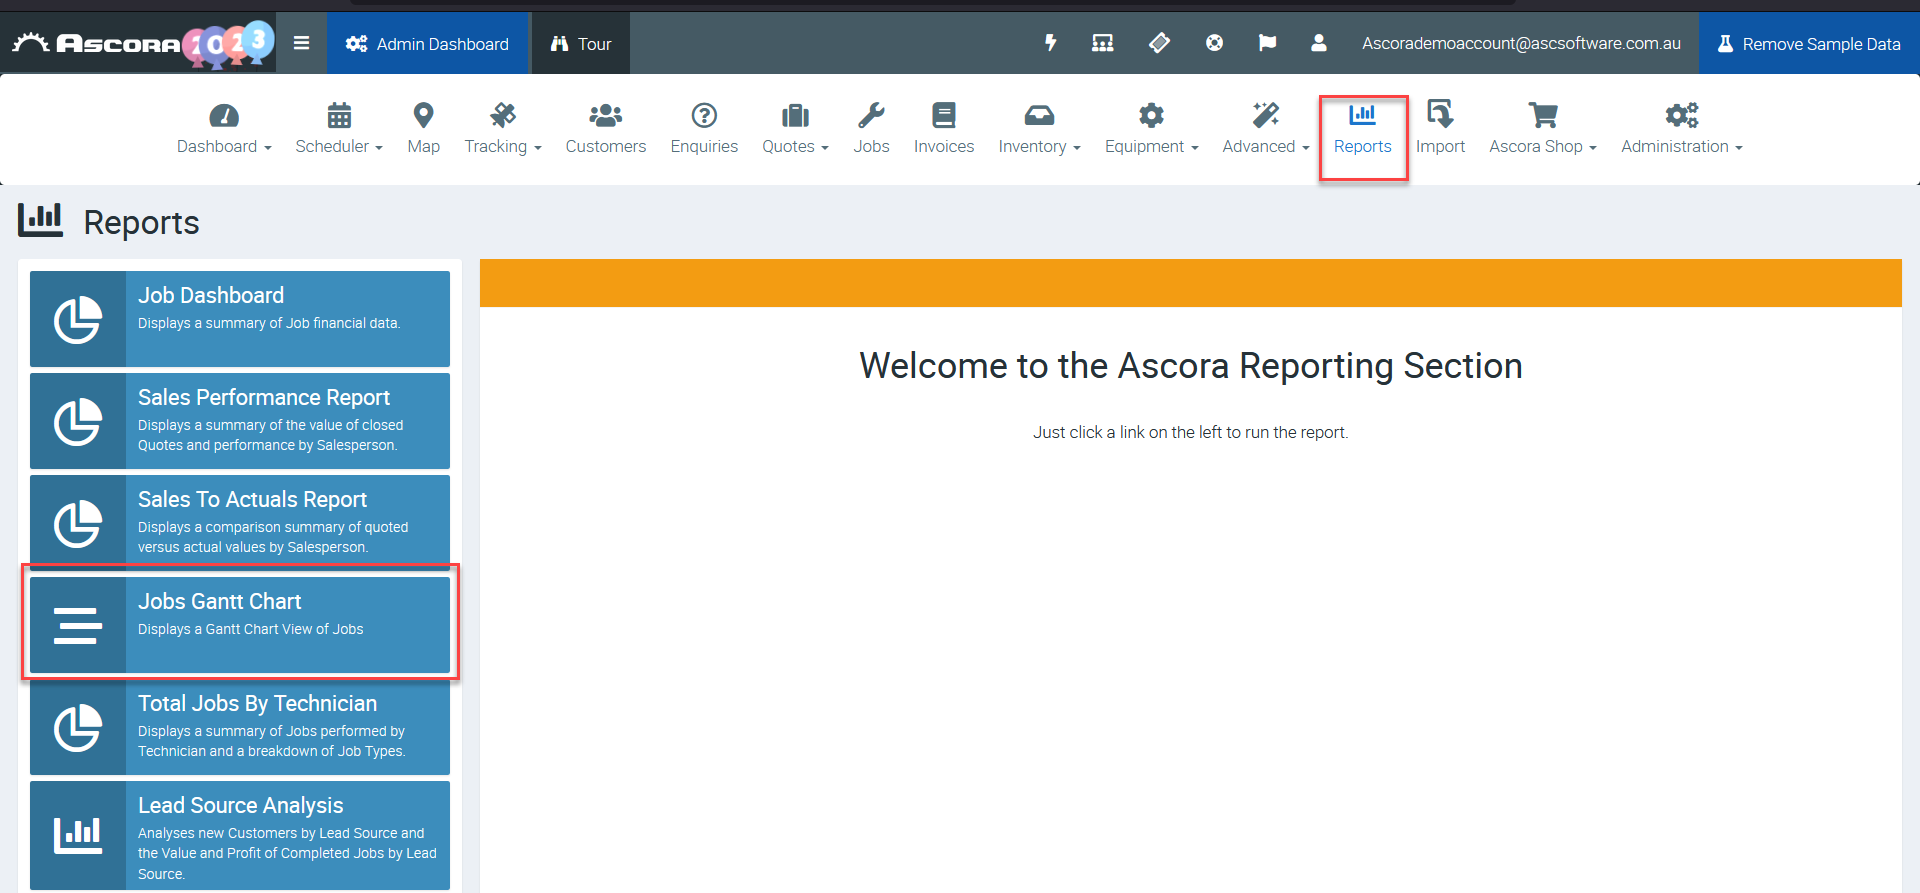
Another way to access Gantt Chart is to go to Reports and select Jobs Gantt Chart from the reports list.
Gantt Chart Overview
Here's an overview of the functionalities available in the Gantt Chart such as filter options, changing the view from weekly to monthly, adjusting task dates, and many more.

How to Display Projects Only
Projects are your section-based or stage-based jobs which you can display by ticking the box beside "Projects Only" and clicking on the "Generate Gantt Chart" button.
You can also click on the black triangle beside the parent job to toggle the view such as hiding or showing the section jobs.
How to edit Start/End Dates & Completion Percentage
Double-click the job box and you'll see a pop-up box where you can edit the dates and completion percentage.
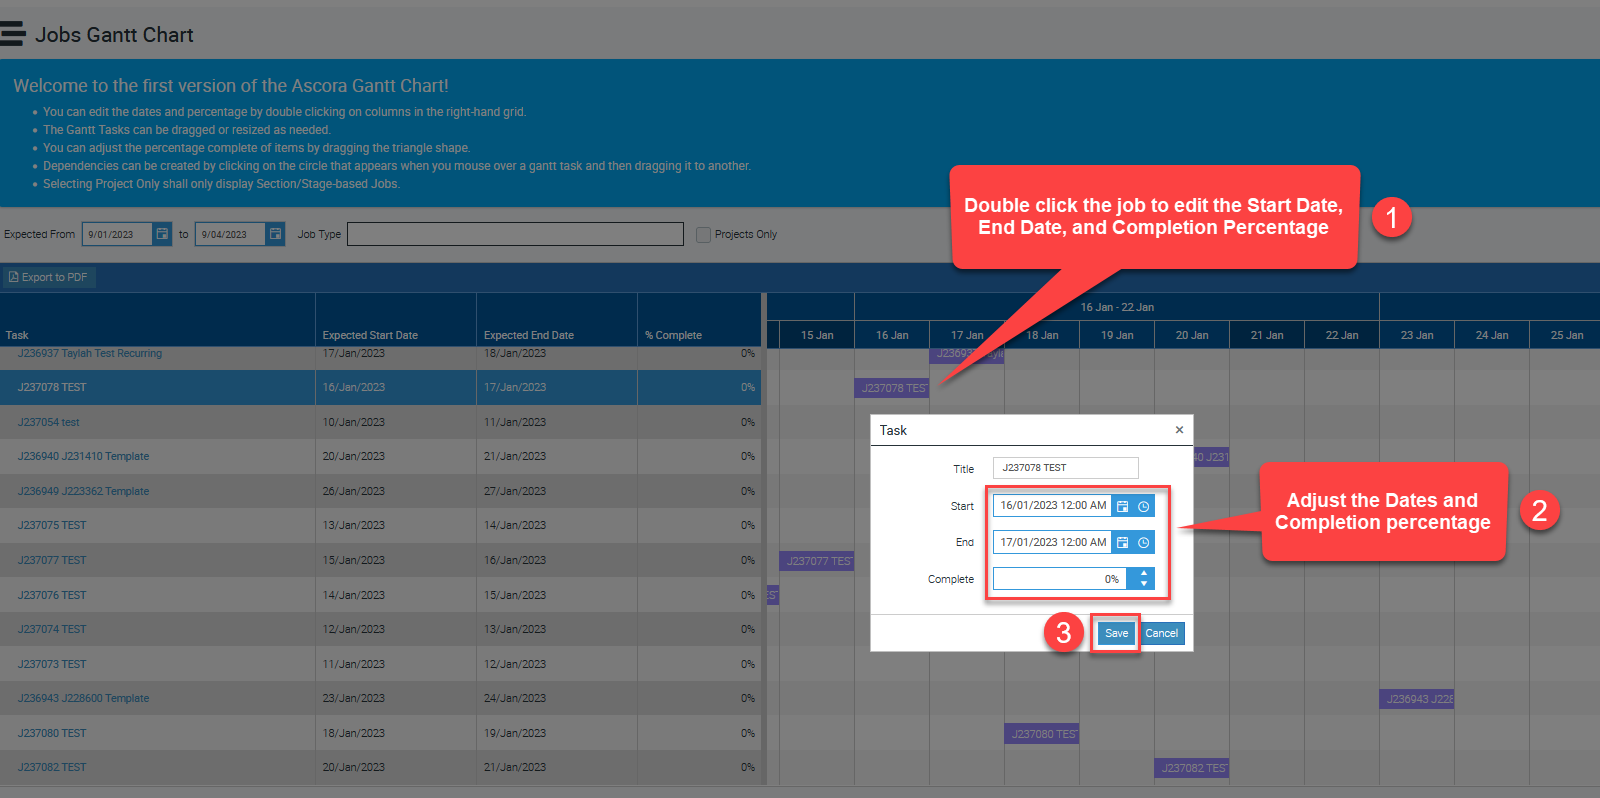
Adjusting the dates and completion percentage
Another way to adjust the completion percentage is to hover the mouse cursor over the box until you see the little triangle which you can drag right or left to adjust accordingly.
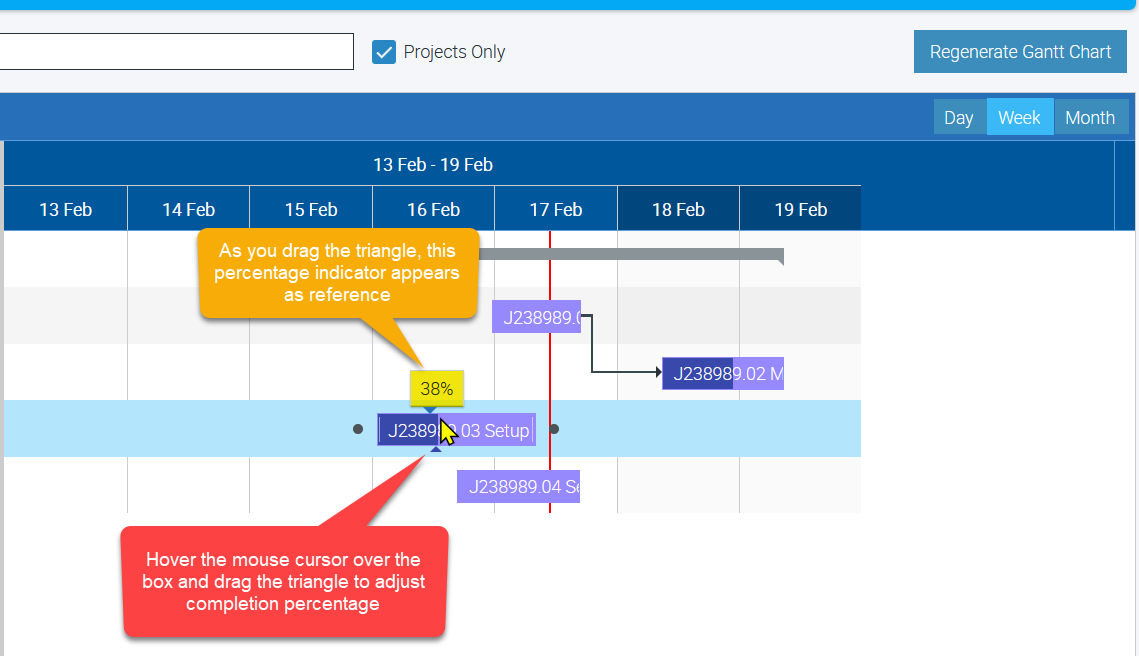
Adjusting the completion percentage by dragging the triangle icon
How to Reschedule Tasks
You can drag and resize the tasks if needed by hovering the mouse cursor on the edge of the box until you see the double arrow which you can drag to reschedule the task or project. You can drag and drop to move a task or project to a different date.
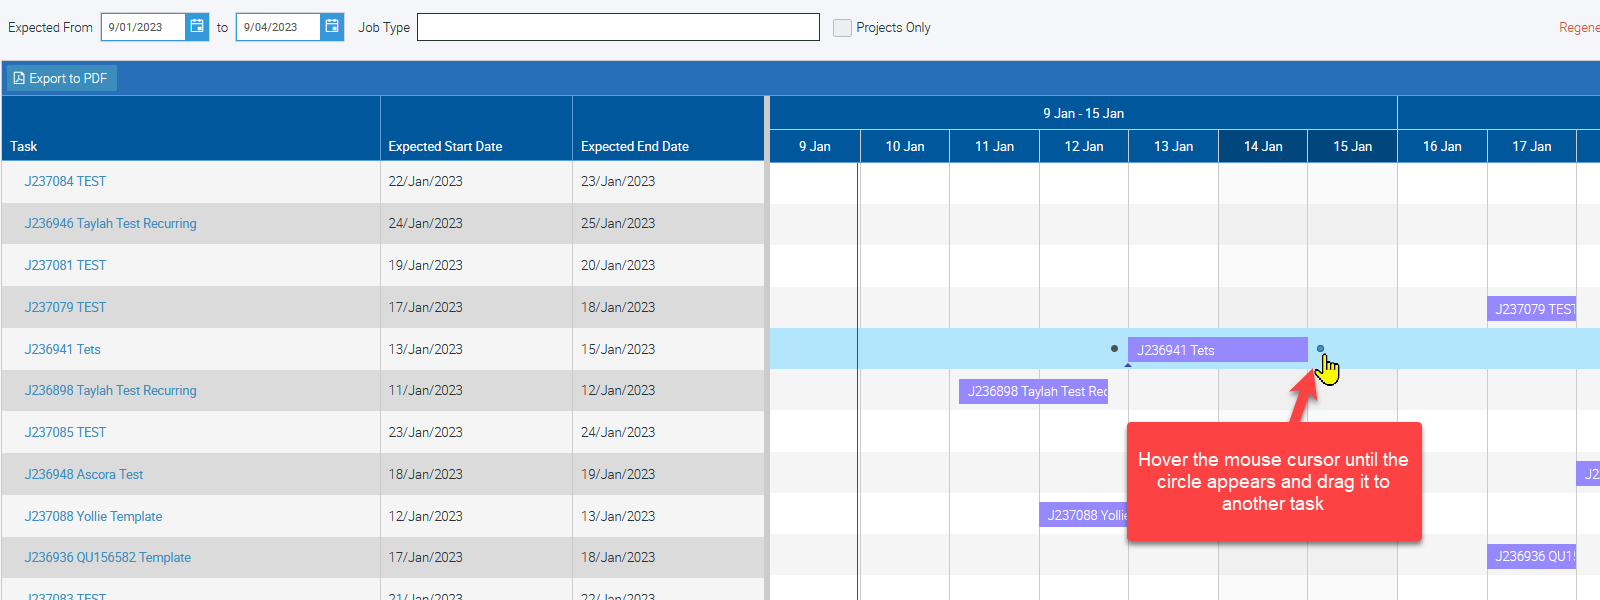
How to Create Dependencies
You can create dependencies between two tasks or projects in the Gantt Chart and once configured, these tasks will have lines connecting them to show these dependencies.
1. Hover the mouse cursor over the task or project until you see the black circle and drag it to the other task or project you need to connect it to.
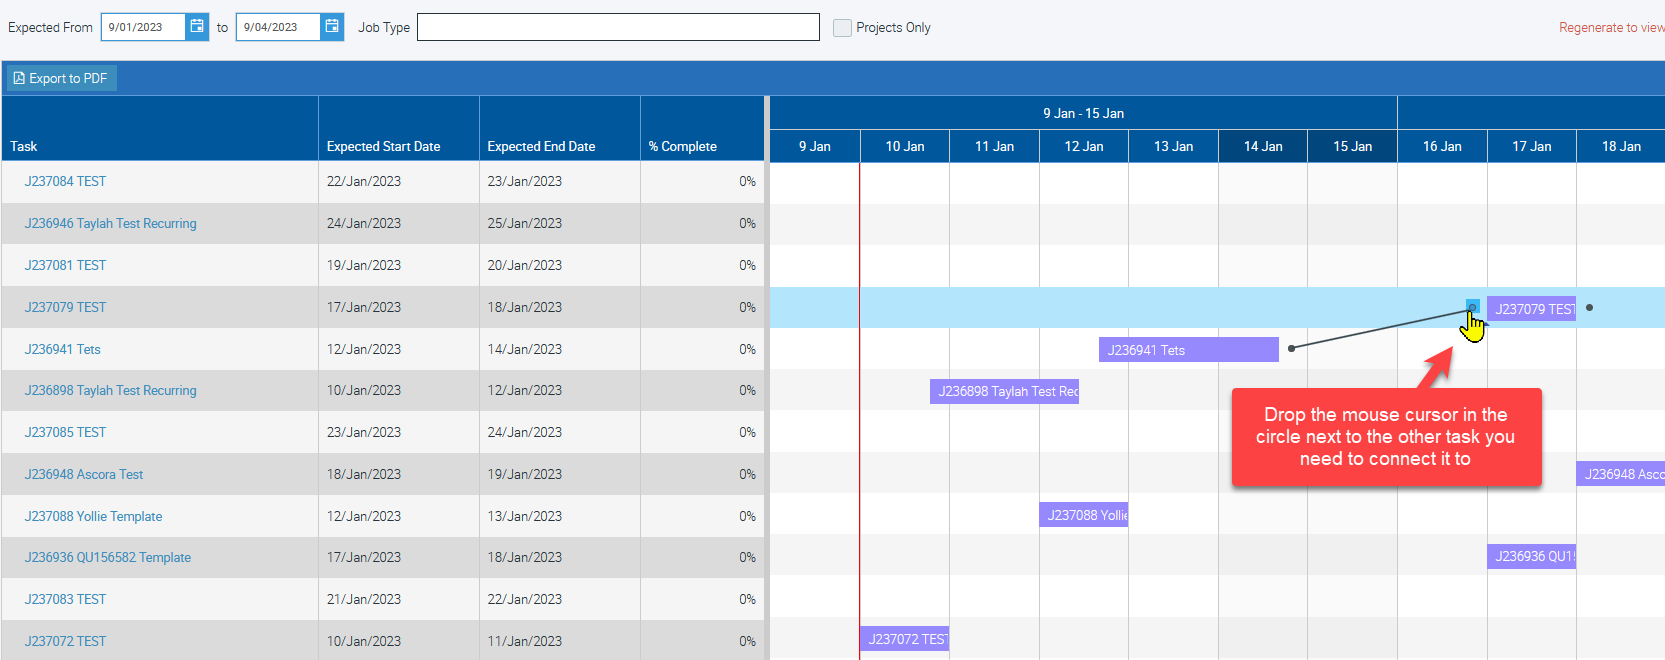
2. Drop the mouse cursor in the circle next to the other task as shown in the image below.
3. The line connecting two tasks automatically adjusts or changes its format.
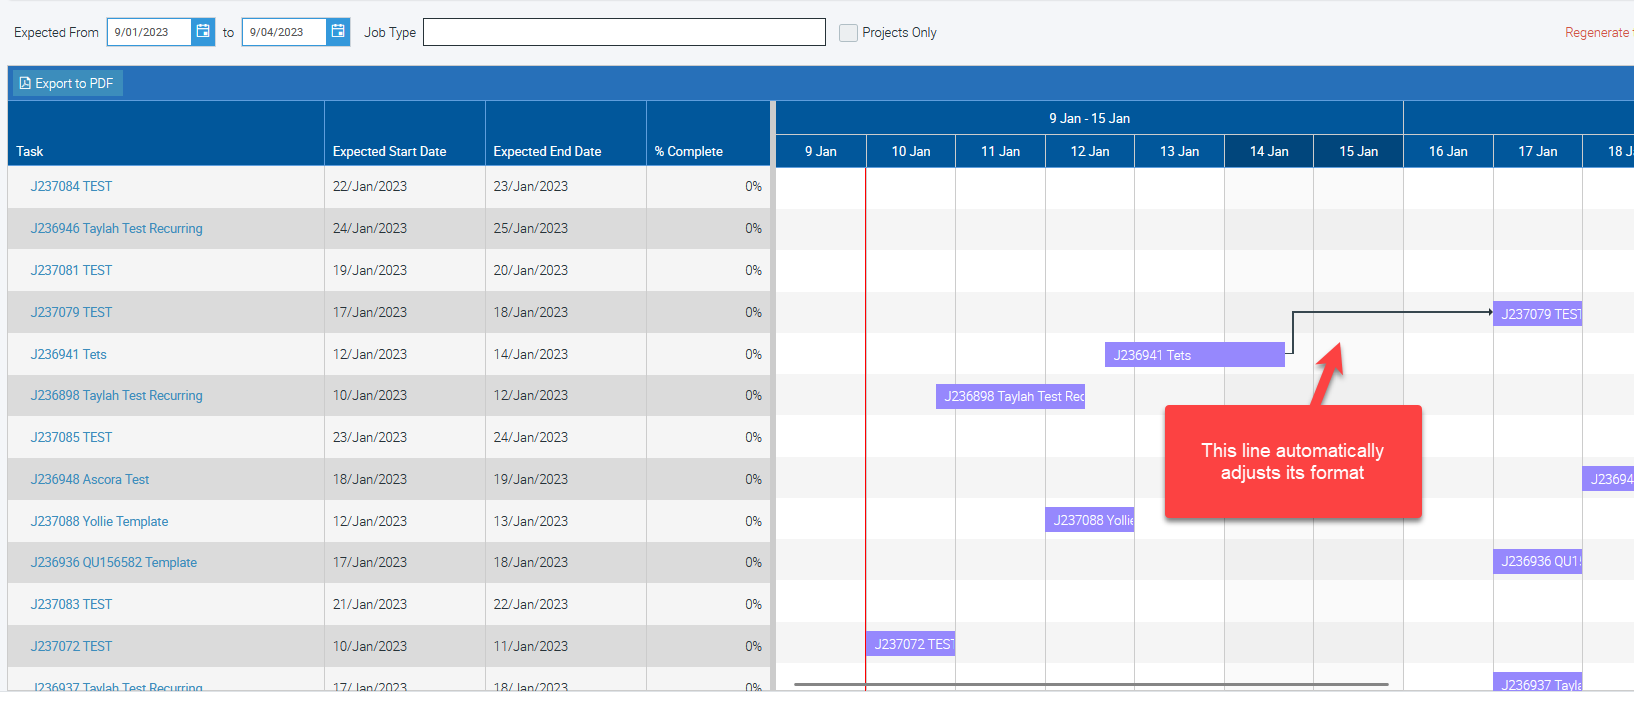
Creating Dependencies
How to Remove Dependencies
To remove dependencies between tasks or projects, click on the arrow and press the Delete key on your keyboard.
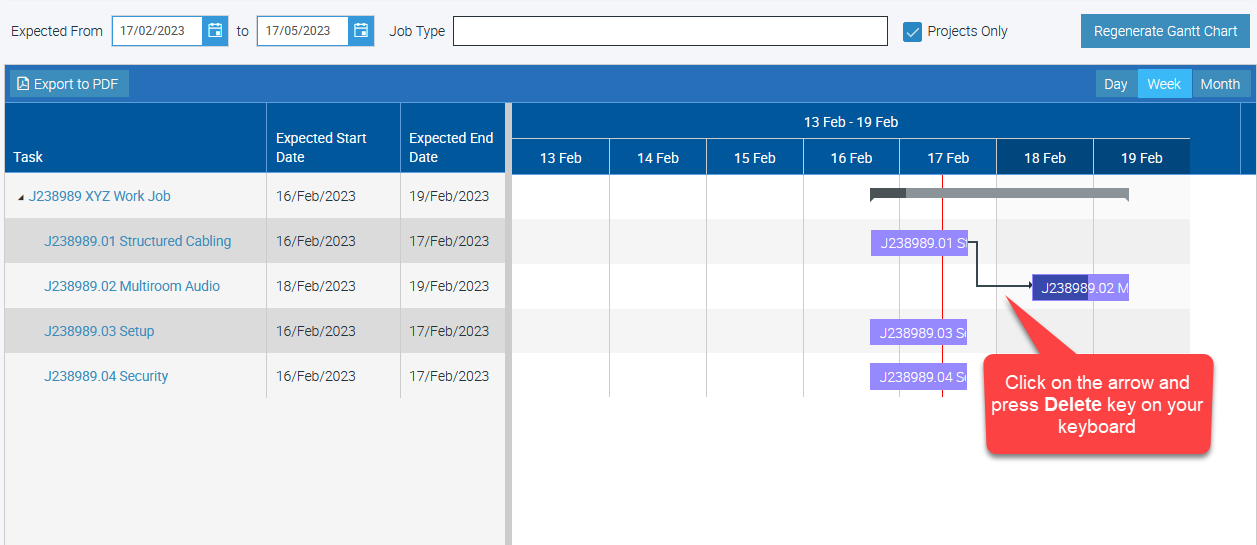
Removing Dependencies
How to Resize the Gantt Chart
Hover the mouse cursor on the grey vertical line right next to the % Complete column which automatically changes to a blue vertical line.
Drag to the left side to decrease the task list box.
Note: You can drag it all the way across to the left side to completely hide the task list if preferred.
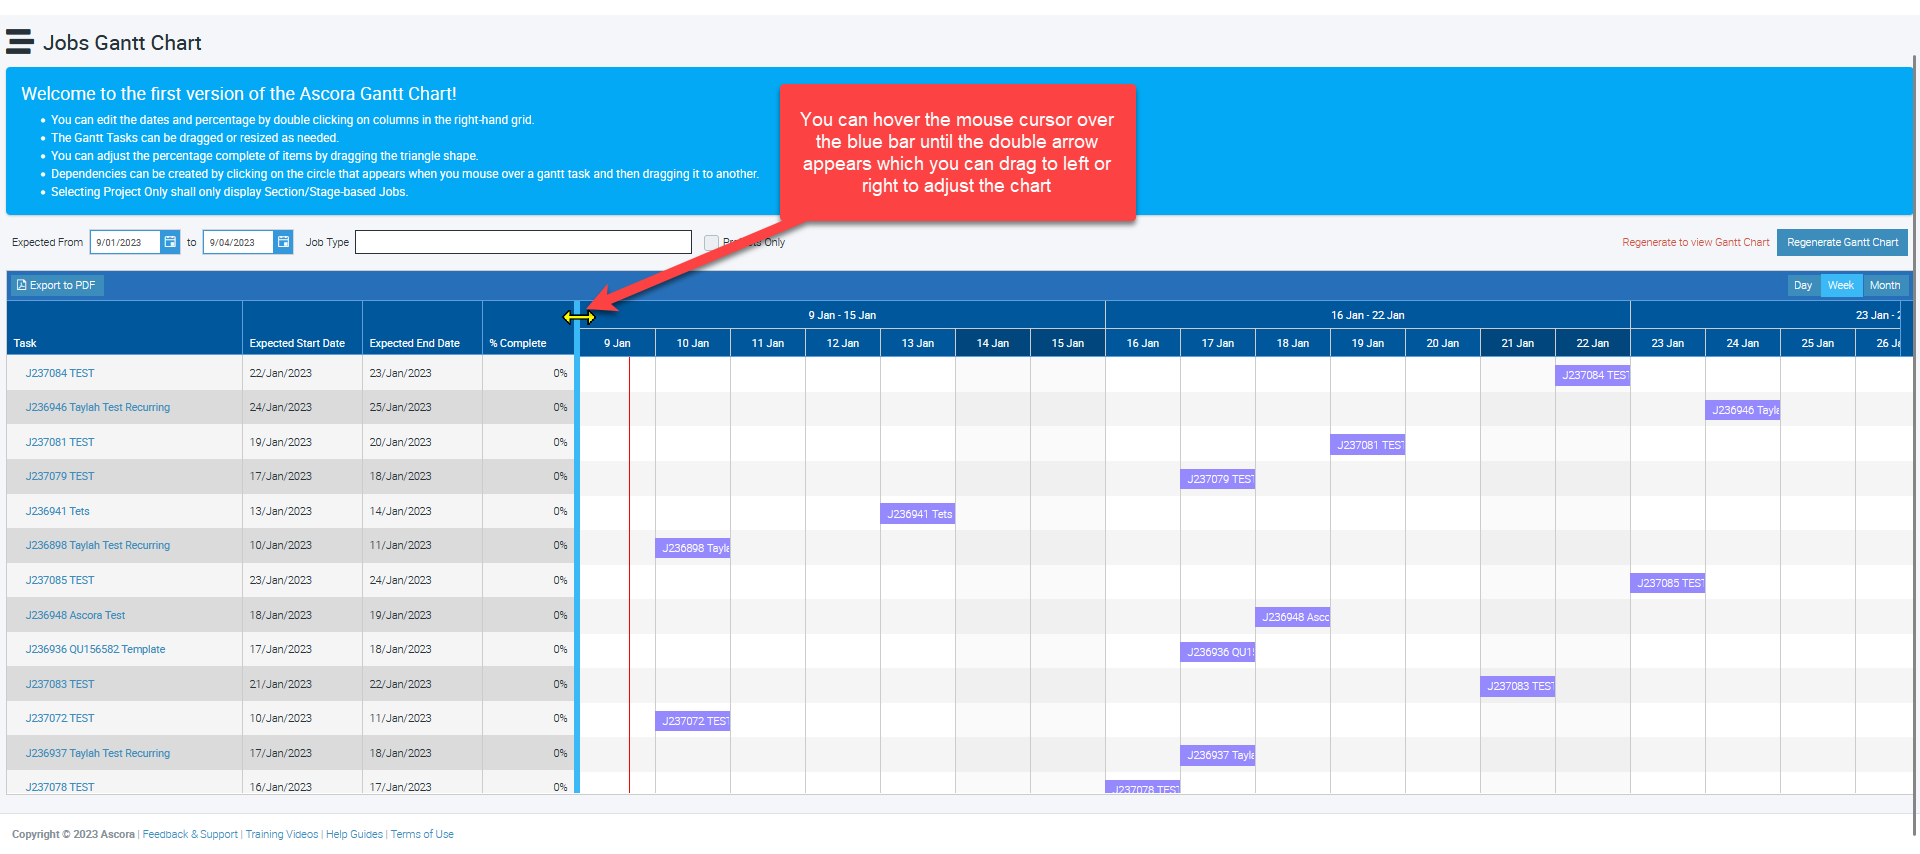
Resizing the Gantt Chart
Got a question?
Submit an Idea 💡 Go to Ideas Portal